American Forest LogoLCI Logo
PHOENIX AZ

From Heat Crisis to Shade Solutions: Beating the Heat in Public Parks

The City of Phoenix is leading the way to cool its neighborhoods and make public spaces safer year round. Learn how cutting-edge shade data is turning plans into action.
SCROLL TO READ
Phoenix is ground zero for extreme heat. In 2024, the county recorded its hottest summer yet, nearly 2°F hotter than 2023, with 113 days above 100°F.

The impact is devastating. Heat-related deaths in the county have surged 900% since 2014, from 61 to 645 deaths in 2023. An average of 13 people died every day in July 2023 from exposure. Nearly two-thirds of those deaths occurred in Phoenix alone.
Extreme heat poses the greatest risks to children and seniors, as well as people with health sensitivities, limited coping resources or high exposure to heat.

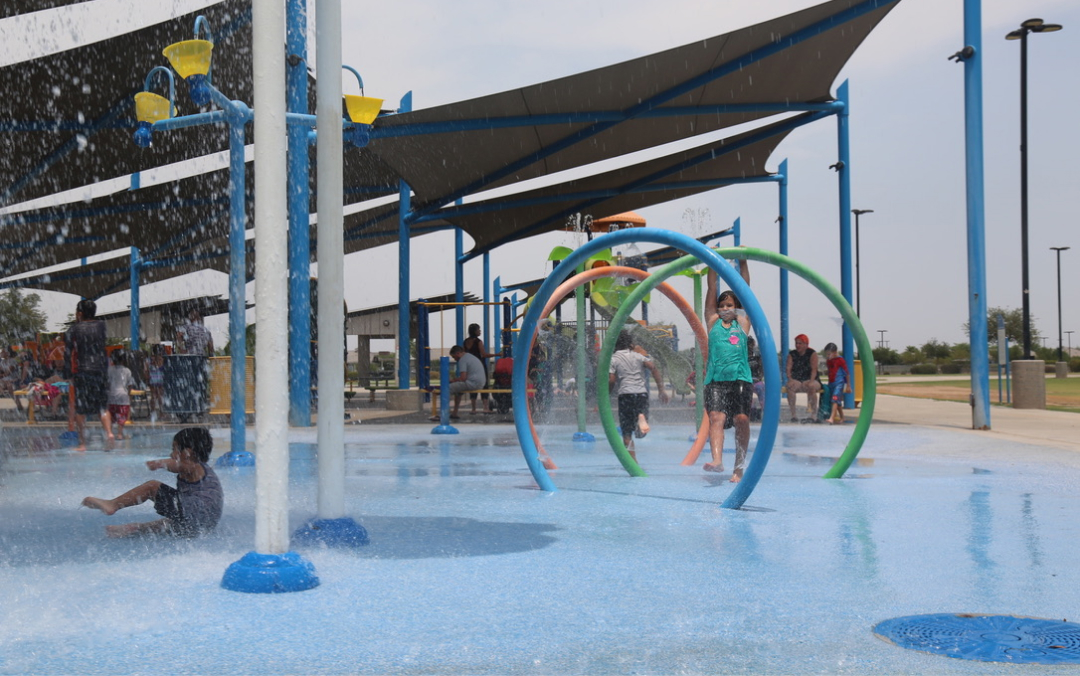
But here's the game-changer: shade reduces heat burden by up to 50%, making sweltering parks, playgrounds and streets feel cooler.1

UCLA Luskin Center for Innovation

For any city grappling with extreme heat, shade isn't just an amenity — it's essential infrastructure.
The ground-breaking 2024 Shade Phoenix Plan commits over $60 million to shade investments in just 5 years, focusing on equity and prioritizing lower-income communities.

The plan outlines 36 clear actions for key spaces, including parks and playgrounds, which serve as lifelines for cooling and recreation.
The plan establishes shade recommendations to guide citywide improvements, ensuring shade is placed where it matters most — where people gather and where use is more intensive.

Minimum shade coverBetter shade coverOptimal shade cover
High duration heat exposure, forced outside wait, use by high-risk populations, or high intensity activityHighest Priority: Bus stops, playground equipment and seating100%100%100%
School pick up/drop off zones, intersections, sidewalks, plazas, eating areas, parking spots, play area sidelines, bleachers, event queue areas25%50%75%
Short duration heat exposure, low occupancy, or light activityResidential yards, open space, dog parks, parking lots, open space in parks10%20%30%

Shade Phoenix Plan, pg. 43

To make this vision a reality, Phoenix has a powerful new tool. In partnership with the UCLA Luskin Center for Innovation and American Forests, state-of-the-art, county-wide shade data is now available through the Maricopa County Tree Equity Score Analyzer.

This tool provides high resolution information and supports people-centered urban planning to address damaging outcomes that result from inequitable tree distribution.

UCLA's analysis uses 2020 LIDAR and Microsoft Building Footprints to model vegetation (primarily trees) and built features, then applies a shade algorithm on June 21, the longest day of the year, at noon, 3 p.m. and 6 p.m.
UCLA Luskin Center's raw shade data at noon, 3 p.m. and 6 p.m.
The data estimates 2020 shade cover, how it changed over the course of a day and where it was missing.

We applied the data for insights about Phoenix parks. At midday, shade levels in 2020 were below the "optimal" recommendation (30% cover) in 89% of parks. 20% of parks were below the minimum level (10% cover).
↓ Interactive chart: Hover for more info. Toggle to switch from noon to 6 p.m. shade.
Trees and shade structures in parks and playgrounds create, on average, 7 times more shade than buildings. Trees also provide evapotranspirative cooling, absorb pollutants and provide mental health benefits, among other advantages.

Shade cover within parks can also be inconsistent. Phoenix's new recommendations call for 100% shade over play structures and, ideally, 75% for pools, play zones and picnic areas.
In Cactus Park, the play areas and parking lot barely meet or fall below minimum shade levels at noon, despite the park meeting overall recommendations. In contrast, Eastlake Park falls short of the overall "optimal" shade level, but its play and parking areas come closer to meeting recommendations due to the placement of trees and shade structures.
Splash park and playground protected by shade sails in Phoenix AZ.
Shading high-use areas is critical. Direct sunlight can make play equipment and surfaces dangerously hot, and physical activity can lead to overheating.

Shade data makes it easier to plan natural and engineered shade where people gather and where activity is most intense.
The Shade Phoenix Plan provides the roadmap. Shade data gives you the tools. Here's how you can take action to cool your community.
Explore parks in this interactive shade map. See whether your local park meets shade recommendations — and how shade changes from midday to evening hours.
TESA iPad interface
Pinpoint shade gaps for the Greater Phoenix Area using the Maricopa County Tree Equity Score Analyzer:

  1. Visit Tree Equity Score Analyzer.
    • Log in or create a free account.
  2. Search for your park, other point of interest or address.
    • Zoom in until you see parcel and right-of-way segments.
    • Open the Layers list to toggle shade cover estimates at three times of day.
  3. Visualize opportunities for improvement.
    • Identify hotspots where trees or engineered shade structures could make the biggest impact.
Creating a cooler, safer and more equitable Phoenix requires action and collaboration across all sectors.

  • Use the data to prioritize shade investments where they're needed most.
  • Leverage these tools to design shade solutions that keep public spaces functional year round.
  • Spread the word about the Shade Phoenix Plan and discover how shade can transform your parks and neighborhoods.
  • Amplify communications around extreme heat risk and preparedness using this helpful guide from UCLA.
Phoenix is setting the standard for cities across the globe facing the extreme heat crisis. Let's get to work — and stay cool.
Like this story? Check out how other cities are using shade data and tackling extreme heat in Austin, TX and Detroit, MI.
Story Credits: Article and design by Julia Twichell at American Forests. Shade modeling and data analysis by Dr. Isaac Buo. Collaboration, review, and analysis by Lana Zimmerman and Dr. V. Kelly Turner at UCLA Luskin Center. Computational support by ASU SHaDE Lab. Collaboration and review by David Hondula (Arizona State University and City of Phoenix Office of Heat Response and Mitigation) and Mary Wright, Lora Martens, and Julia Marturano (City of Phoenix Office of Heat Response and Mitigation). Story construction by Geri Rosenberg at American Forests. This project was made possible by funding from the Robert Wood Johnson Foundation.
For more information about UCLA Luskin Center's shade data, please contact Dr. V. Kelly Turner, Associate Professor of Urban Planning and Geography, at vkturner@ucla.edu.
Photo credits: All photos by Rick D'Elia / D'Elia Photographic, unless otherwise noted. Photo of the sun, public domain. Photo of a bus shelter, Shade Phoenix Plan / City of Phoenix. Small splash park photo by Joel Clark / American Forests.
1 Turner, V. K. et al. (2023). “The problem with hot schoolyards.” UCLA Luskin Center for Innovation, https://innovation.luskin.ucla.edu/publication/the-problem-with-hot-schools/.
Methods: One-meter resolution shade was modeled at noon (minimum shade), 3 p.m. (hottest time of day), and 6 p.m. (maximum shade) using high-resolution 2021 USGS LIDAR point cloud data and Microsoft Building Footprints on June 21, the longest day of the year.

Four surface models were created using LIDAR: (1) all features above ground (FDSM), (2) ground elevations, (3) a Building Surface Model and (4) a Canopy Model. A Building Surface Model was generated by extracting pixels in the FDSM within Microsoft Building Footprints. The Canopy Model extracted all other pixels in the FDSM, and defined trees and other non-building shade features as pixels with heights greater than 1.3 meters. All other above-ground elevations were set to 0 because they are not high enough to provide shade for the average person standing outdoors (Buo et al., 2023). The Canopy Model predominantly reflects tree shade; however, it also contains other non-building features such as shade sails that are treated like trees.

The shadowing function of the SOlar LongWave Environmental Irradiance Geometry (SOLWEIG) model proposed by Lindberg et al. (2008) simulated the shade distribution from surface models at 1-m resolution. Total shade is a function of the transmissivity of foliated vegetation for shortwave radiation and shadows from buildings and tree canopy (Lindberg & Grimmond, 2011).

Unlike shade generated from the Building Surface Model, shadows from the Canopy Model can occur underneath an elevated feature (such as under tree canopy, a bridge, or a shade sail). The result are binary rasters that indicate the presence or absence of shade, including building shade, tree and other shade and total shade rasters. These rasters can be analyzed to calculate percent shade cover for any polygon using zonal statistics.
© 2025 American Forests. All Rights Reserved.